Lessons from MHA Screening
2023 Mental Health Data and Trends
In 2014, Mental Health America (MHA) created the Online Screening Program (www.mhascreening.org), a collection of 11 free, anonymous, confidential, and clinically validated screens that are among the most commonly used mental health screening tools in clinical settings. Since its launch, 25,683,320 people have taken a screen to check their mental health concerns online, making this program the nation’s largest ongoing, real-time mental health early identification program. The program has grown exponentially since 2014, from an average of 1 million screens per year to a staggering 6 million a year since 2021. With this uptick in screens, more people are experiencing anxiety, depression, psychosis, loneliness, and other mental health concerns.
MHA’s online screening reach has transformed dramatically. Historically, 90% of our screeners were from the U.S. Our population has been roughly 50% domestic screens and 50% international screens since 2022. In 2023, over 6.5 million (n= 6,514,986) people took a mental health screen globally; specifically, 2,117,466 of those screens were domestic, 2,730,078 were international screens, and about 1,648,821 screens did not answer the “Do you live in the U.S.?” question.
This report is an analysis of responses from the 2,117,466 screens among those who self-reported living in the US. This excluded users who did not answer that particular question and users who identified as being international screeners. Analysis of survey respondents shows that users who opt out of answering questions report higher risk (scoring higher at risk for symptoms) as compared to users who share demographic information. In 2023, 99% of domestic users answered at least one demographic question.
Key Findings
- Youth are struggling with their mental health and are seeking support online. 41% of individuals in the U.S. who took a screen in 2023 were under 18.
- Across all screens, 79% (N=1,667,892) of users in the U.S. scored positive with moderate to severe symptoms of a mental health condition in 2023. This was equal to the average in 2022.
- The number and percentage of people screening with moderate to severe symptoms of anxiety remain higher than rates prior to COVID-19, and are particularly severe for youth and Black, Indigenous and people of color screeners. The percentage of people in 2023 scoring with moderate to severe symptoms of anxiety was highest among American Indian or Alaska Native screeners (84%).
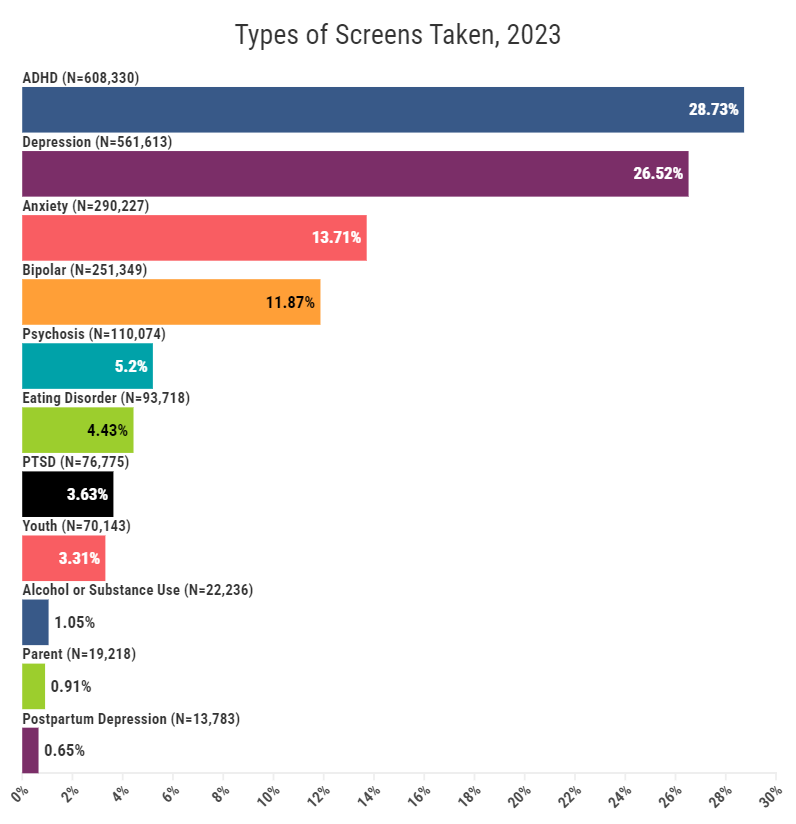
- Within 18 months of its addition, the ADHD screen has surged in popularity, eclipsing depression to become the most popular screen in 2023.
- Overall, 36% (N=201,497) of individuals in the U.S. who took the depression screen reported frequent suicidal ideation in 2023.
- Rates of suicidal ideation are highest among youth, especially LGBTQ+ youth of color. Overall, 49% of all youth depression screeners under 18 reported frequent suicidal ideation on more than half or nearly every day of the previous two weeks. LGBTQ+ youth identifying as Other race were most likely to report suicidal ideation (64%).
- Rates of suicidal ideation for all BIPOC screeners were higher than rates for white screeners. 40% of BIPOC screeners reported frequent suicidal ideation, as opposed to 33% of white screeners.
- Analysis of substance use screeners show that the most common drug of concern was alcohol (48%). Transitional-age youth are most affected by issues with alcohol and substance use, with 84% of screeners ages 18-24 being at risk for a substance use disorder.
- People screening at risk for mental health conditions are struggling most with body image or self-image and relationship problems. The differences in the things contributing most to mental health concerns among individuals of different races and ethnicities reveal inequities in the experience of 2022-2023. Among individuals who screened positive or moderate to severe for a mental health condition in 2023, 58% reported that one of the top three things contributing to their mental health concerns was body image or self-image. This was followed by 49% reporting relationship problems and 47% reporting school or work problems.
- Analysis of users' written responses shows that users are struggling with self-deprecation, social relationships, stress with managing symptoms and feelings of despair.
2023 Screening Demographics
In total, 2,117,466 people from the United States took a screen through MHA Screening in 2023.
Roughly 64%of screeners identified as female, 32% identified as male, and 5% identified as non-binary. Nearly 6% of screeners from the U.S. (N=116,687) identified as transgender in 2023. These trends in gender are comparable to trends seen in 2022 data.
As the No. 1 screening tool on search engines such as Google and Bing, the MHA Screening Program has helped to respond to unmet needs and bridge gaps in communities that are most vulnerable to mental health conditions. MHA screening data continues to provide insightful real-time information from users who have yet to or cannot access traditional health care systems. Unlike other data sets, the MHA screening population is help-seeking, meaning it is largely representative of populations that are most likely to seek help for mental health conditions (young and female). MHA screening demographics for race, income and geographical samples also align with U.S. Census data.
Forty-one percent of screeners in 2023 were under 18, a 3% increase from 2022 (38%). People under 25 made up over two-thirds of all screens for 2022 (66%) and 2023 (65%).
Age range (excludes youth and parent screen)
8-10: 0.95% , N=19057
11-13: 12.88%, N=257838
14-15: 13.59%, N=272,035
16-17: 11.19%, N= 224,092
18-24: 25.29%, N=506,353
25-34: 18.49%, N=370,218
35-44: 9.43%, N=188,718
45-54: 4.67%, N=93,414
55-64: 2.36%, N=47,153
65+: 1.15%, N=22,950
Race/Ethnicity
The race/ethnicity demographics of U.S. screeners in 2023 were mostly on par with demographics from 2022. Notably, the percentage of Asian and multiracial screeners increased and Black or African American screeners decreased slightly.
American Indian Or Alaska Native: 1.96%, N=39,877
Asian: 7.27%, N=147,820
Black Or African American (Non-Hispanic): 8.78%, N=178,541
Hispanic Or Latino: 14.84%, N=301,805
Middle Eastern Or North African: 0.95%, N=19,251
Native Hawaiian Or Other Pacific Islander: 0.48%, N=9,727
White (Non-Hispanic): 56.90%, N=1,157,137
More Than One Of The Above: 6.12%, N=124,532
Other: 2.71%, N=55,103
Household income
Screeners in 2023 reported higher household incomes than those in 2022. Thirty-seven percent of screeners in the U.S. reported a household income of less than $40,000 in 2023, compared to 42% in 2022. A quarter (25%) of screeners in the U.S. reported a household income of $100,000 or greater in 2023, compared to 22% of screeners in 2022.
Household Income Less Than $20,000: 19.67%, N=318,206
Household Income $20,000-$39,999: 17.31%, N=279,918
Household Income $40,000-$59,999: 15.54%, N=251,360
Household Income $60,000-$79,999: 12.67%, N=204,927
Household Income $80,000-$99,999: 9.74%, N=157,119
Household Income $100,000-$149,999: 13.08%, N=211,595
Household Income $150,000+: 12.01%, N=194,303
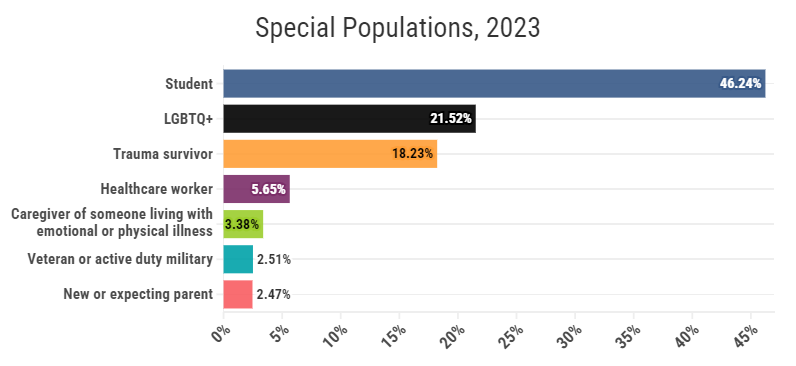
We also ask screeners “Which of the following populations describes you? Check all that apply.” Overwhelmingly, 46% of responses (N=1,070,463) included student, followed by LGBTQ+ (22%, N=498,237) and trauma survivors (18%, N=421,967).
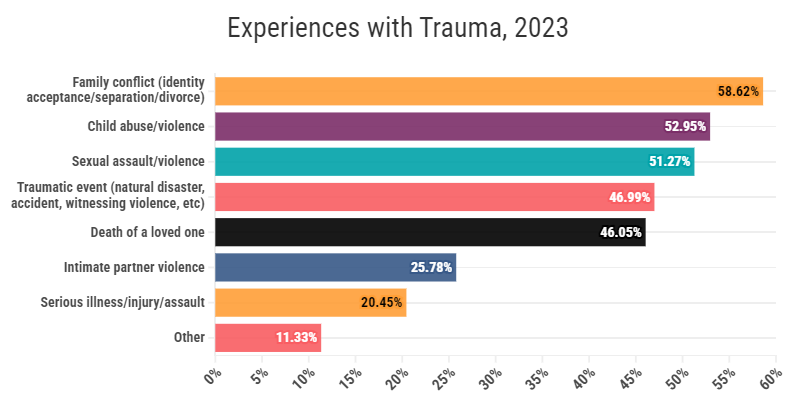
We also invited trauma survivors to elaborate more on their experiences with trauma. Nearly 60% of responses included family conflict as a source of trauma. This was followed closely by child abuse/violence and sexual assault/violence.
Which mental health screens users are taking
For the first time ever, depression dropped to the second most popular screen taken by users. The most popular screens taken were ADHD (29%), depression (27%), anxiety (14%), and bipolar screens (12%).
Across all screens, 79% (N=1,667,892) of users in the U.S. scored positive or with moderate to severe symptoms of a mental health condition in 2023. This was slightly more people when compared to 2022 (N=1,618,617). Fifty-four percent (N=835,987) had never received treatment or support before.
The only noticeable rate increase in screeners at risk was for the psychosis screen, up two percentage points from 2022. The stagnant rates in severity could be a reflection of screeners adjusting to new norms as a result of the aftermath of the COVID-19 pandemic.
Screening results
467,512 at risk
2022: 83.71%
2023: 83.24%
226,160 at risk
2022: 78.77%
2023: 77.93%
124,497 at risk
2022: 49.21%
2022: 49.53%
88,203 at risk
2022: 78.53%
2023: 80.13%
92,457 at risk
2022: 92.42%
2023: 91.75%
At risk for Avoidant Restrictive Food Intake Disorder (ARFID)
2022: 6.36%
2023: 6.95%
69,628 at risk
2022: 91.34%
2023: 90.69%
54,699 at risk
2022: 79.01%
2023: 77.98%
17,813 at risk
2022: 82.52%
2023: 80.11%
13,926 at risk
2022: 82.52%
2023: 80.11%
11,452 at risk
2022: 83.36%
2023: 83.09%
Americans are Concerned with Attention and Concentration (ADHD)
MHA uses the Adult ADHD Self-Report Scale (ASRS) to screen people for Attention-Deficit/Hyperactivity Disorder. The ADHD screen was added to the MHA website in June 2022. Within six months of its addition, it surged in popularity, eclipsing both bipolar and anxiety in screens per month by October 2022, and by April 2023, it eclipsed depression as the most popular screen on the website.
Since COVID, there has been a rise in popularity of content on social media associated with ADHD and neurodivergence driving increased awareness about the condition. Historically, there hasn’t been sufficient research and support for individuals with ADHD-like symptoms to understand their experiences and to obtain a timely and accurate diagnosis. These challenges are compounded when individuals experience other mental health conditions like autism spectrum disorder, anxiety, or depression.
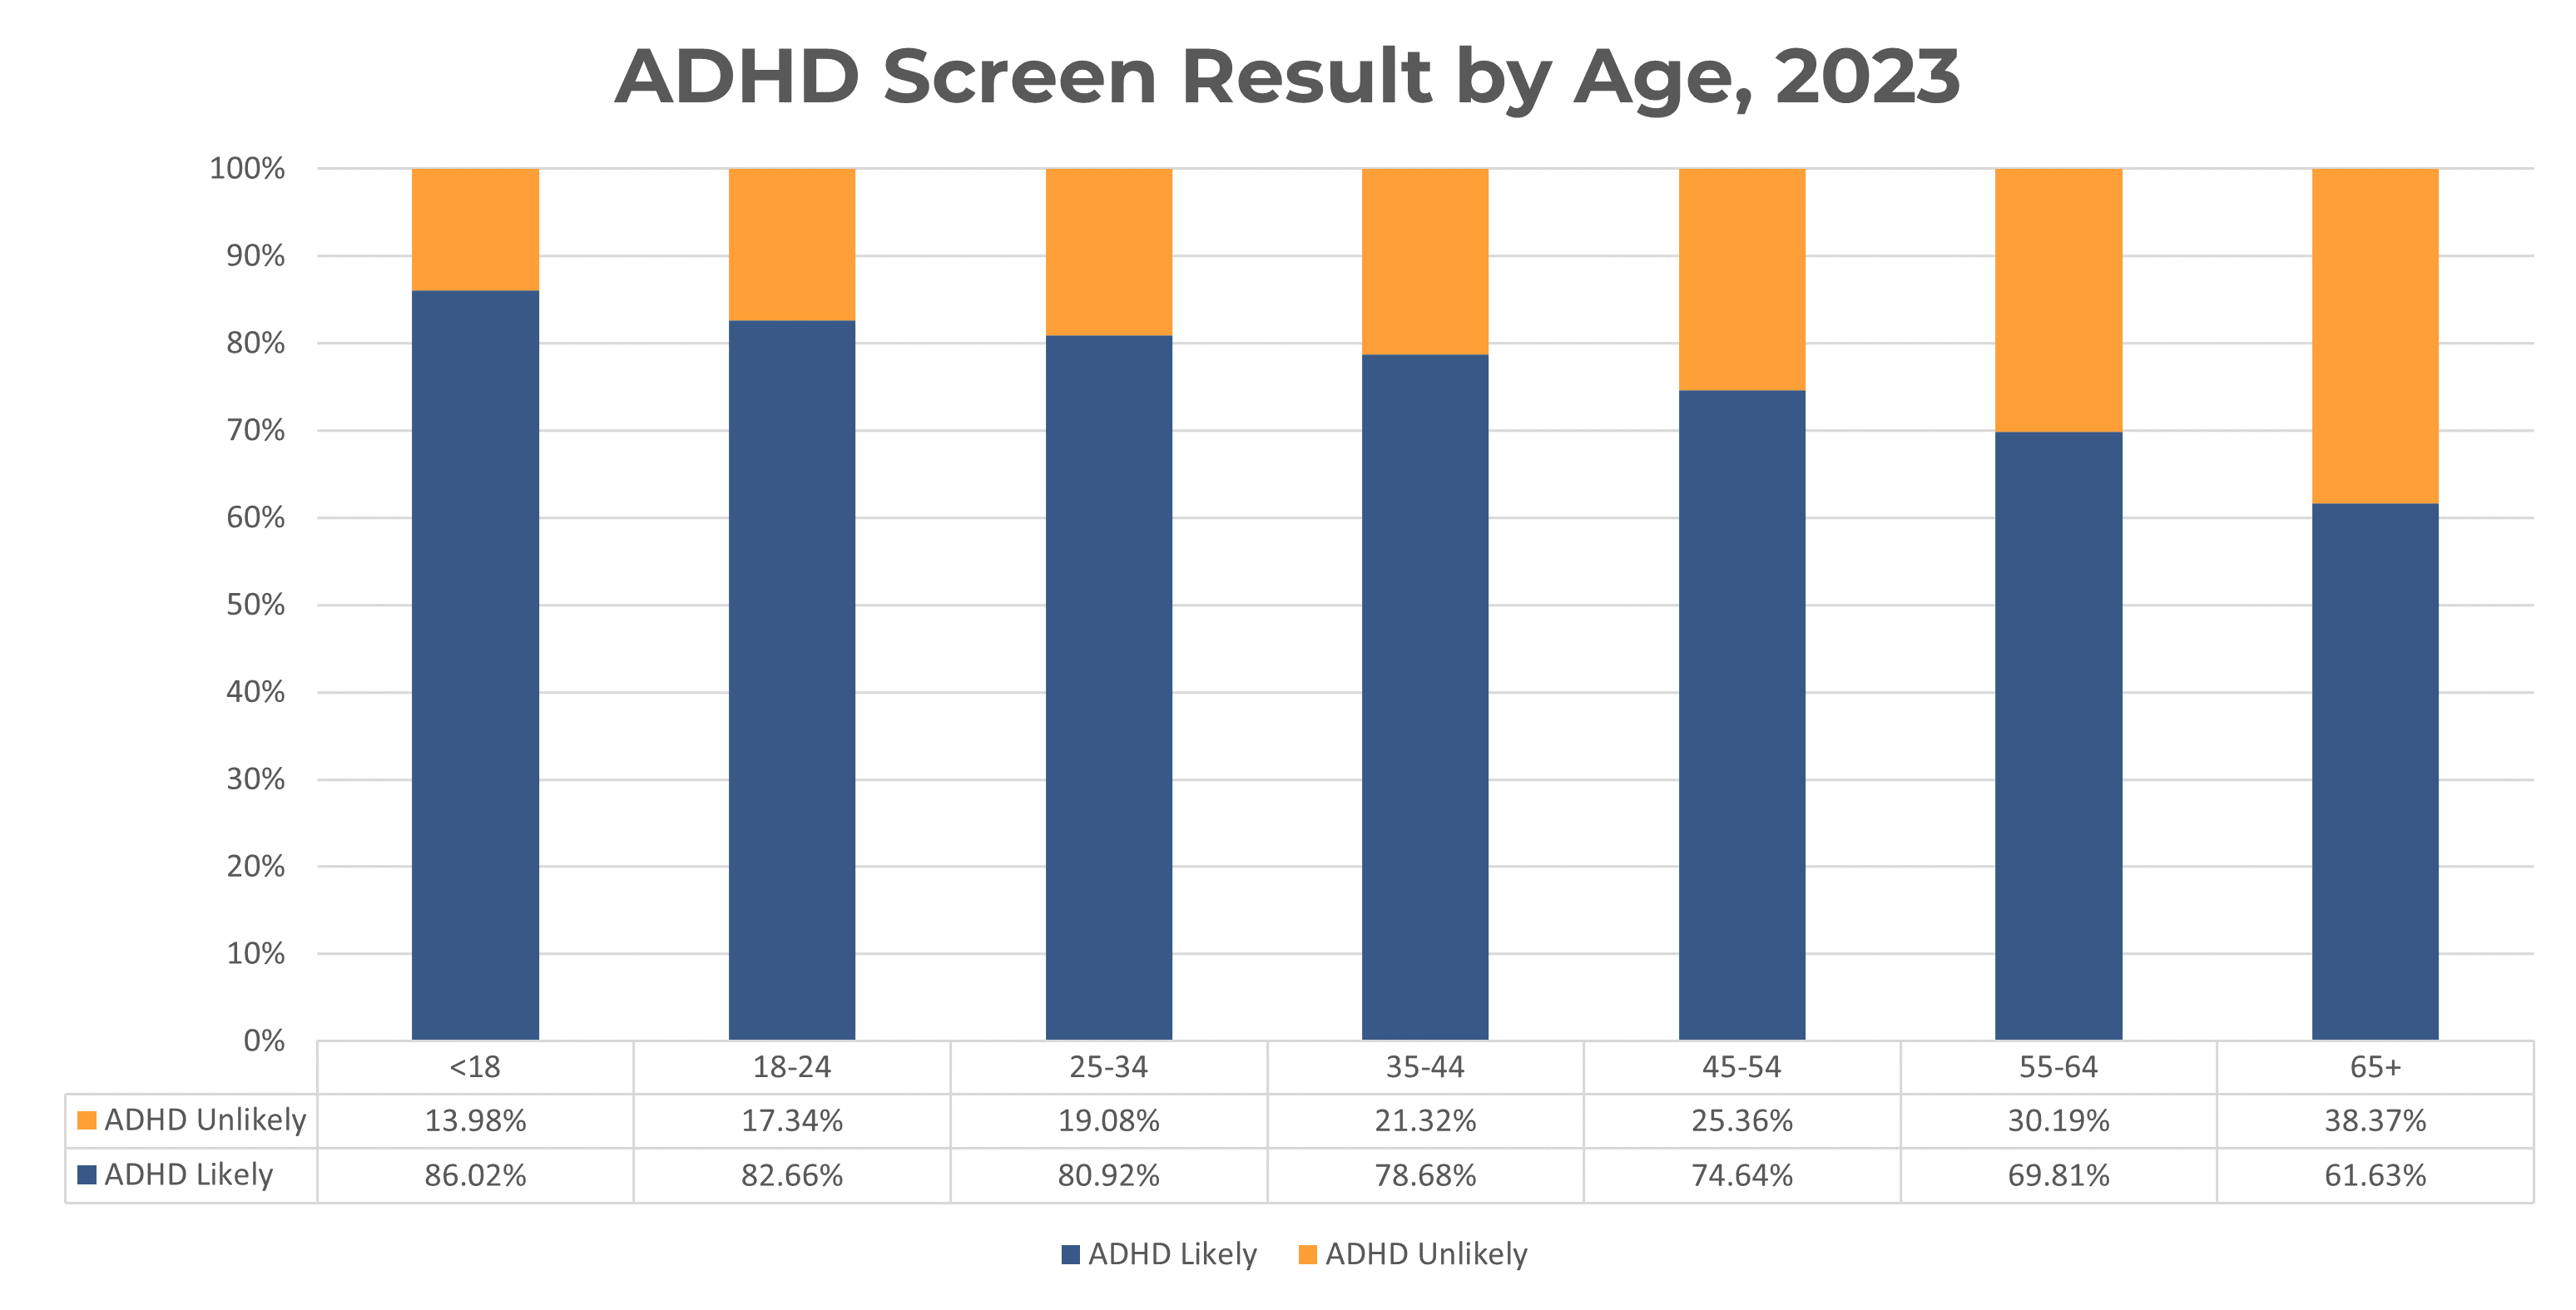
Interestingly, the people taking ADHD screens tend to be slightly older than the general screening average. About 64% (2023) of ADHD screeners are over 18, compared to the 59% of screeners over 18 in the general population. Despite this, ADHD screeners under 18 have the highest screening severity, with about 88% of youth scoring at risk.
The difference in age among ADHD and other popular screens might indicate the challenges associated with self-identification of ADHD. Youth may be more aware of how depression and anxiety is impacting their experiences in childhood and we become more aware of attention and concentration issues as we enter the workforce.

An analysis of 20,665 screeners who were at risk and took the ADHD screen provided insightful information of what users are struggling with. For those screeners, ADHD symptoms seem to overlap with other conditions, with anxiety (N=3,397) and depression (N=1,683) being the most commonly mentioned. Other often-used terms were “trauma” (N=795) and “focus” (N= 572). Analysis of users' written responses to the question, “Think about your mental health test. What are the main things contributing to your mental health problems right now?” reveals frustrations with lack of motivation, inability to complete tasks, anxiety in social situations, and feeling burdened:
- “Lack of time to do a million things I start and never finish”
- “Anxiety about doing simple tasks and having motivation to do things”
- “Thinking everything is insurmountable”
- “Self conscious of people telling me to slow down”
- “Trying to carry everything, which is wearing me down. I’m reluctant to ask for help”
- “Not living up to the expectations I have for myself due to easily being distracted”
- “I have no one to show me how to properly deal with pain or basic emotions”
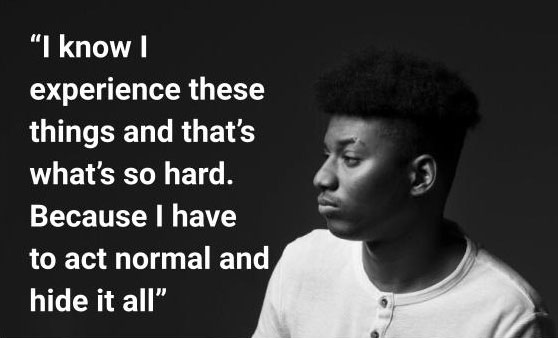
- “I’ve been masking my whole life and I’m exhausted”
- “Having racing thoughts all day everyday day and night”
- “[Not] being accepted by other people”
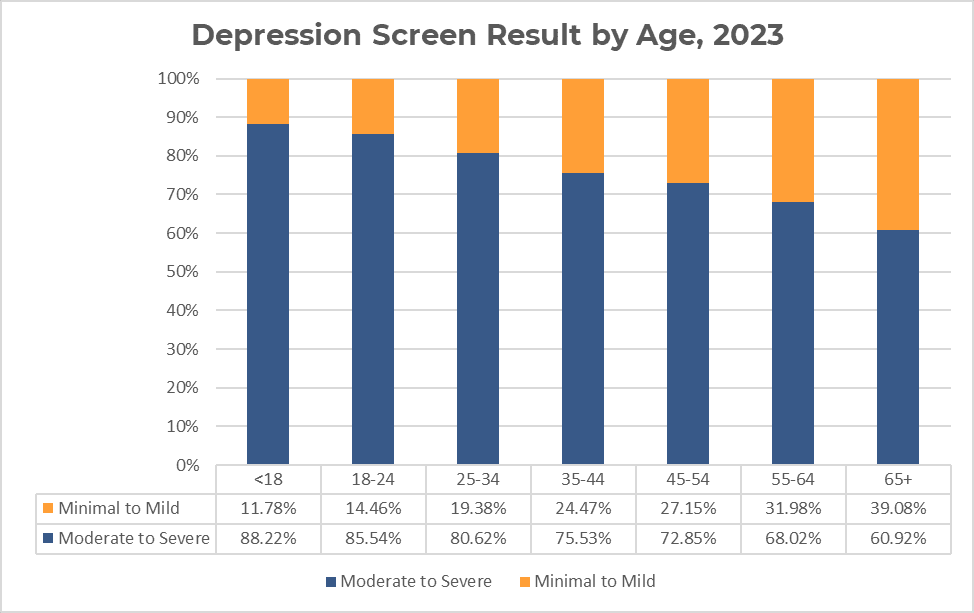
Depression and Suicide/Self-Harm Highest Among Youth, LGBTQ+, More Than One Race, and American Indian/Alaska Native
MHA uses the Patient Health Questionnaire 9-item (PHQ-9) tool to screen for depression. In 2023, 561,613 people in the U.S. took a depression screen, a 11% decrease from the number of depression screens taken in 2022 (N=634,547).
On average, 88% (N=200,628) of people under 18 in the U.S. who took a depression screen scored with symptoms of moderate to severe depression in 2023. Trends indicate that rates of screening severity decrease as age increases.
Both youth under 18 and adults who identify as LGBTQ+ and took a depression screen were nearly 10% more likely to screen with moderate to severe depression than non-LGBTQ+ youth and adults.
Under 18
LGBTQ+: 94.34%
Non-LGBTQ+: 85.51%
Over 18
LGBTQ+: 88.19%
Non-LGBTQ+: 79.65%
In 2023, 83.24% of all screeners who took a depression screen scored at risk (moderate to severe on the PHQ-9). The percentage of people scoring with moderate to severe symptoms of depression was highest among screeners who identified as more than one race (88%) and the lowest among those who identified as Asian (80%). Rates of moderate to severe depression in 2023 were comparable to 2022 for screeners of every race/ethnicity.
American Indian Or Alaska Native: 87.51%
Asian: 79.77%
Black Or African American (Non-Hispanic): 81.31%
Hispanic Or Latino: 84.67%
Middle Eastern Or North African: 82.21%
Native Hawaiian Or Other Pacific Islander: 84.19%
White (Non-Hispanic): 83.08%
More Than One Of The Above: 88.11%
Other: 84.80%
Youth of color took the depression test more often than youth screeners who were white, but rates of moderate to severe depression were equal among both groups. In 2023, 88% (N=103,704) of youth of color under 18 who took a depression screen scored with moderate to severe depression, compared to 88% (N=89,173) of white youth. When results are broken down by race/ethnicity, there are more notable differences. Rates of moderate to severe depression were highest among youth who identified as more than one race (90%) and American Indian or Alaska Native screeners. (90%). Rates of scoring at risk are lowest among screeners identifying as Asian (85%).
American Indian Or Alaska Native: 90.14%
Asian: 84.57%
Black Or African American (Non-Hispanic): 87.18%
Hispanic Or Latino: 88.59%
Middle Eastern Or North African: 86.63%
Native Hawaiian Or Other Pacific Islander: 88.62%
White (Non-Hispanic): 88.40%
More Than One Of The Above: 90.34%
Other: 89.79%
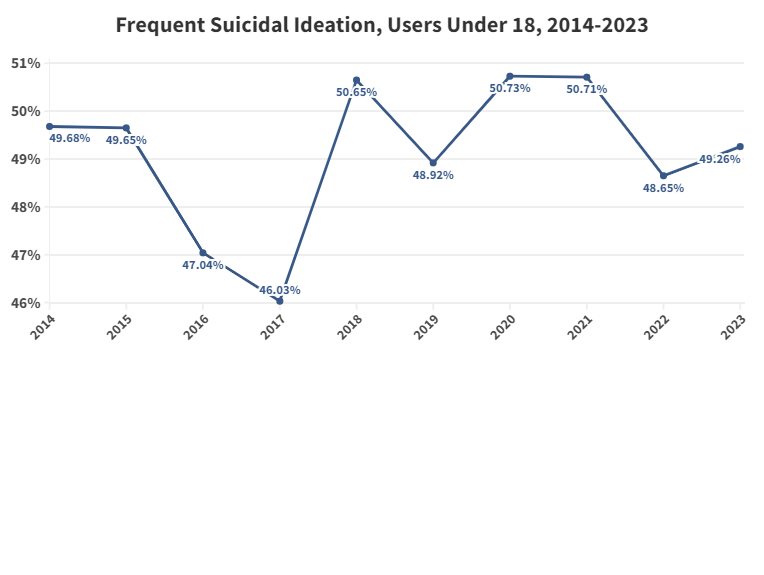
Suicidal/self-harm thinking, especially among young people, was epidemic in 2022 and 2023. Since June of 2020, MHA has seen a steady increase in the rate of frequent suicidal ideation. Overall, 36% (N=201,497) of individuals in the U.S. who took the PHQ-9 screen for depression reported frequent suicidal ideation (defined as more than half or nearly every day of the previous two weeks) in 2023. This was at a higher rate than 2022 (35%; N=225,031).
Analysis of survey respondents shows that users who opt out of answering the demographic questions report higher risk of suicide as compared to users who share demographic information.
According to Pew Research, youth suicide risk has trended upwards between 2011 and 2021, with 22% of high school students reporting that they had considered suicide in 2021, up from 16% in 2011. MHA Screening has also seen concerning trends in youth suicidal ideation frequency, more than double the rate reported by Pew. Though rates of ideation have remained mostly stagnant, MHA Screening saw peaks of more than half of youth under 18 reporting frequent suicidal ideation in 2018, 2020 and 2021.
In 2023, 49% (N=111,077) of all youth depression screeners under 18 reported frequent suicidal ideation on more than half or nearly every day of the previous two weeks. This was equal to the 49% of youth reporting suicidal ideation in 2022.
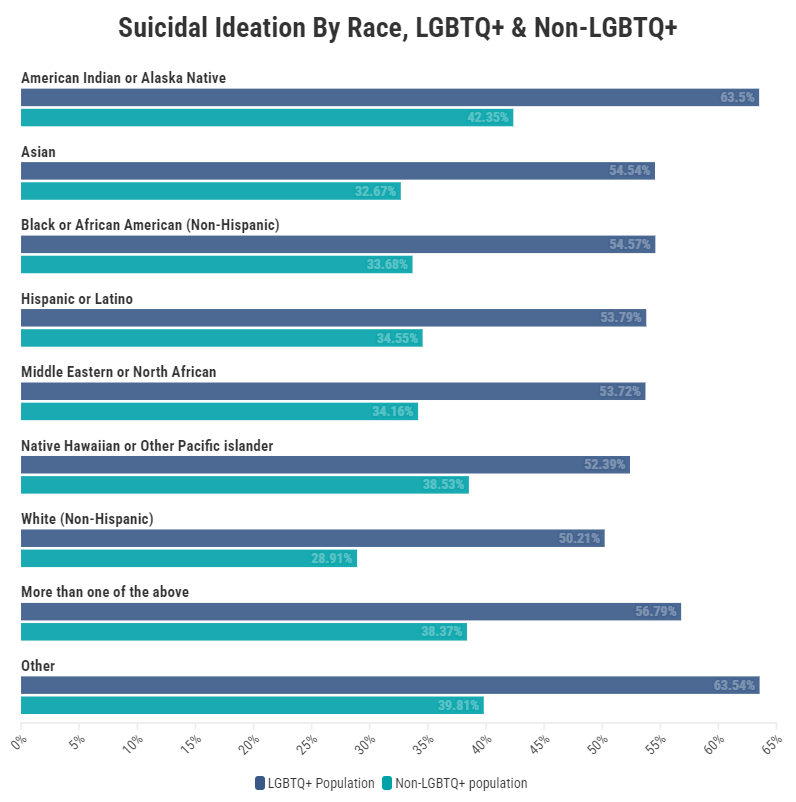
Rates of suicidal ideation (reporting thoughts of suicide “more than half or nearly every day” on PHQ-9 item #9) continue to be much higher than the pre-pandemic average for screeners of every race/ethnicity. In 2023, the percentage of people reporting frequent thoughts of suicide or self-harm was highest among American Indian or Alaska Native screeners (48%), followed by those who identified their race as Other (46%). Interestingly, rates of suicidal ideation for all BIPOC users (40%) were higher than rates for white (33%) screeners.
American Indian Or Alaska Native: 47.99%
Asian: 36.19%
Black Or African American (Non-Hispanic): 37.86%
Hispanic Or Latino: 38.52%
Middle Eastern Or North African: 36.72%
Native Hawaiian Or Other Pacific Islander: 41.19%
White (Non-Hispanic): 33.20%
More Than One Of The Above: 44.27%
Other: 45.70%
Rates of suicidal ideation were also higher among Black, Indigenous, and youth of color than among white youth. Among youth of color, 52% (N=60,191) reported thoughts of suicide or self-harm more than half or nearly every day, compared to 47% (N=46,630) of white youth. The percentage of youth under 18 reporting frequent thoughts of suicide or self-harm was also highest among those who identified their race as “other” (56%), youth who identified as American Indian or Alaska Native (55%), and multiracial youth (53%) in 2023. Overall, rates of suicidal ideation among youth slightly increased across most races/ethnicities.
American Indian Or Alaska Native: 55.22% Asian: 48.19% Black Or African American (Non-Hispanic): 52.46% Hispanic Or Latino: 50.65% Middle Eastern Or North African: 48.34% Native Hawaiian Or Other Pacific Islander: 52.40% White (Non-Hispanic): 46.57% More Than One Of The Above: 52.70% Other: 56.36%
Rates of suicidal ideation were particularly high among people of color who identified as LGBTQ+, greatly exceeding suicidal ideation rates for non-LGBTQ+ populations. LGBTQ+ individuals who identified their race as “Other” had the highest reported rates of suicidal ideation (64%), followed by LGBTQ+ individuals identifying as American Indian or Alaska Native (64%) and those identifying as more than one race (57%).
Unique Generational Challenges Drive High Anxiety Rates
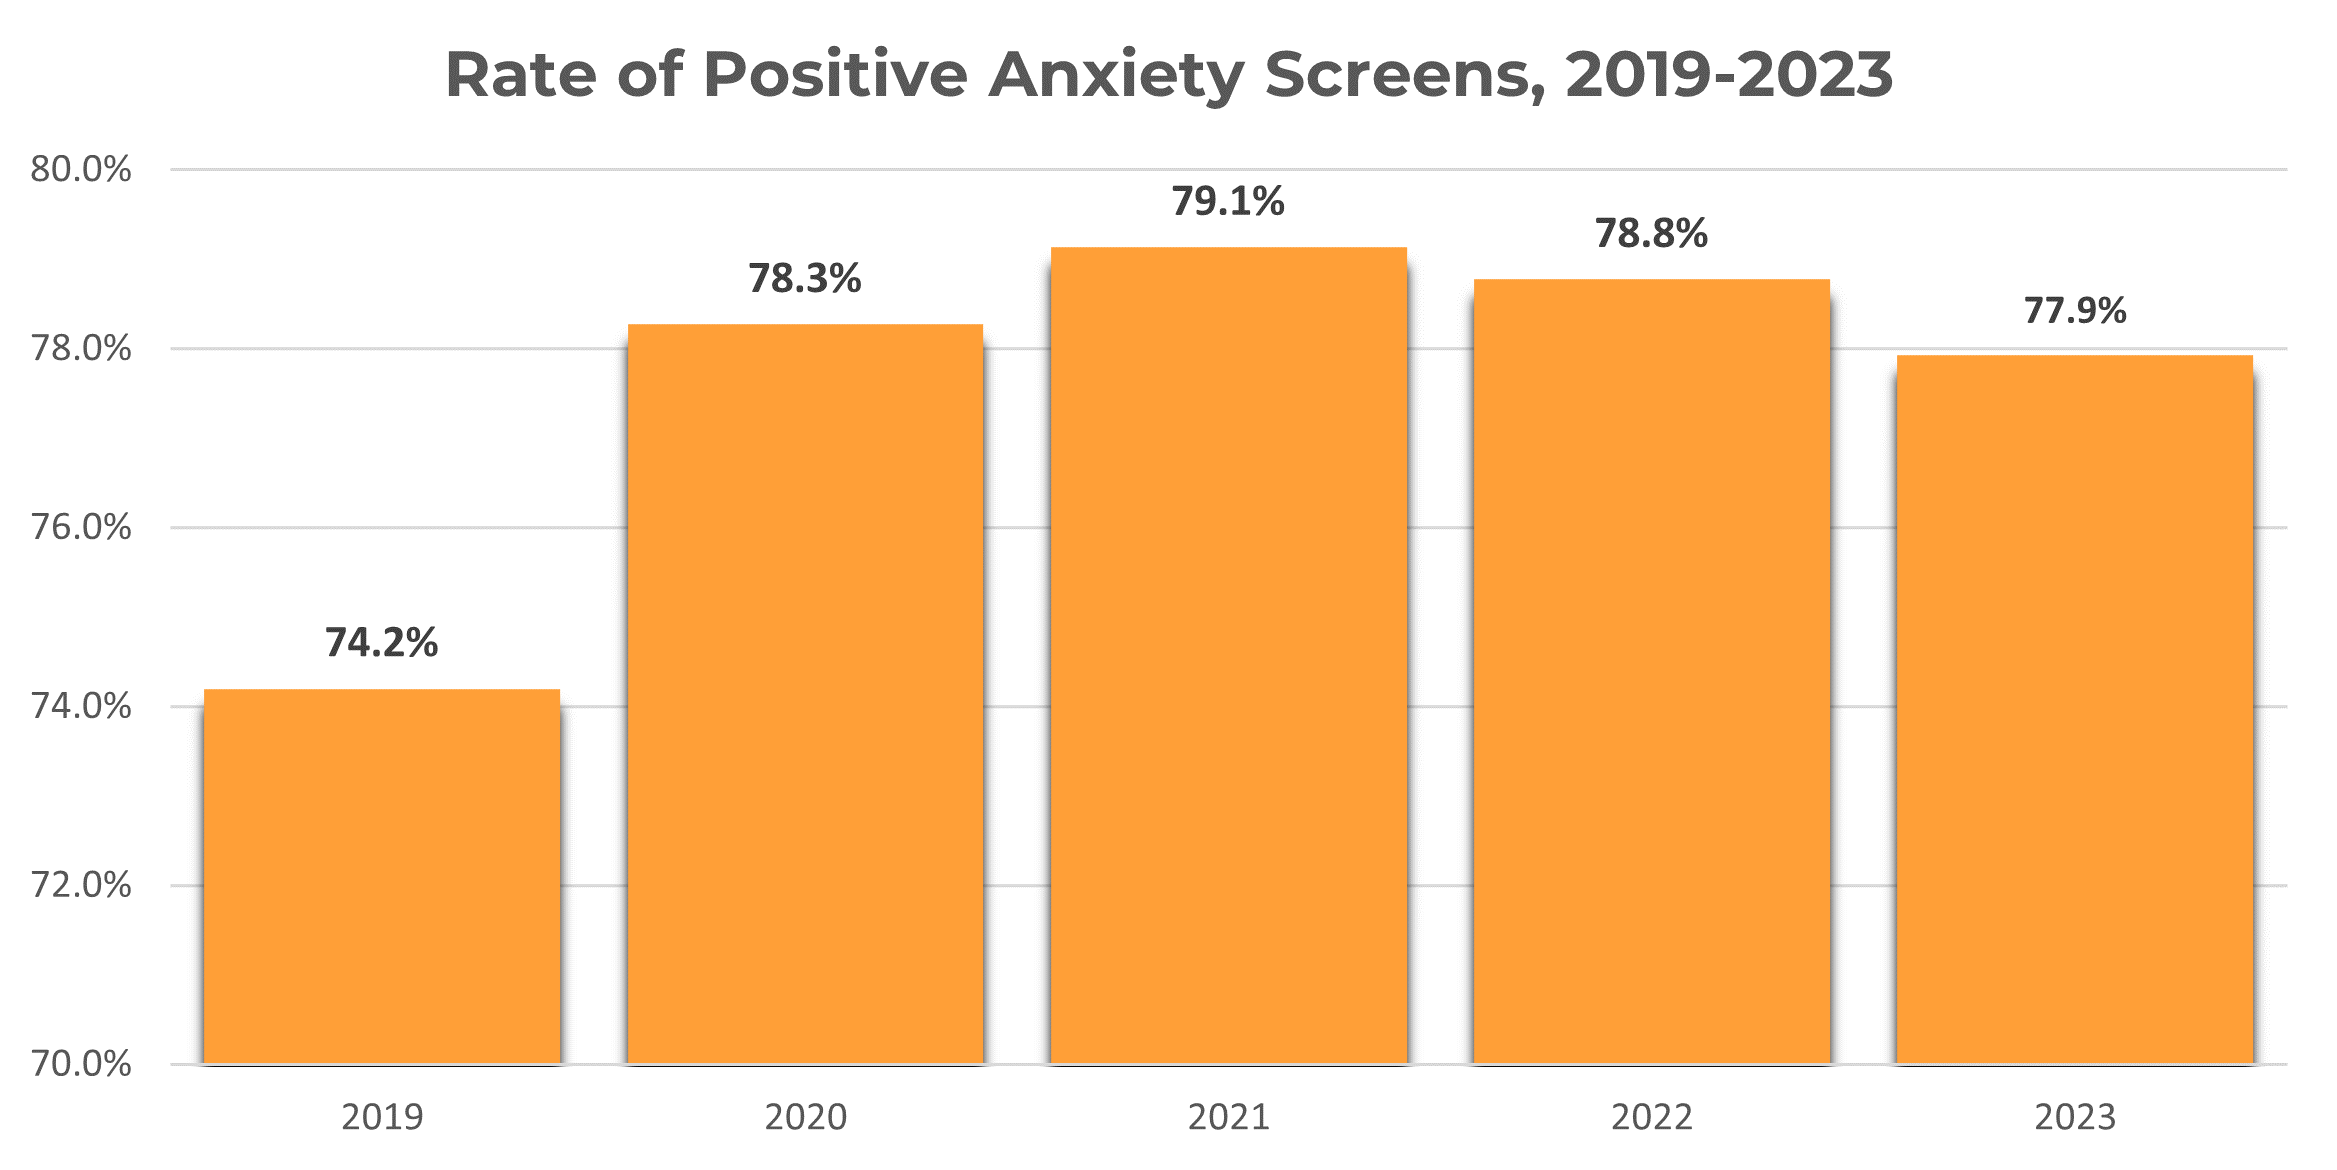
MHA uses the Generalized Anxiety Disorder 7-item (GAD-7) tool to screen for anxiety. The number of help-seekers experiencing anxiety and the severity of that anxiety decreased from 2022-2023. In total, 290,227 people took an anxiety screen in 2023, which was 19% lower than the number taken in 2022 (N=357,968).
Rates of moderate to severe anxiety began increasing in June 2020 and have remained above pre-COVID-19 levels through December 2023. Of the people who took an anxiety screen in 2023, 78% scored with symptoms of moderate to severe anxiety.
In 2023, there were notable differences in psychosis risk across various demographics:
- Non-binary screeners were most likely to be at risk (93%) compared to 81% of female screeners and 76% of male screeners.
- Younger screeners were significantly more at risk. Eighty-six percent of screeners under 25 were at risk for psychosis, while 68% of screeners over 25 were at risk.
- Of trauma survivors who took a psychosis screen, 87% were at risk.
- Multiracial screeners were most at risk (87%), followed by American Indian or Alaska Native screeners (84%).
- Screeners with a household income of less than $20,000 were most at risk for psychosis (84%) and psychosis risk decreased as household income increased.
The rise in psychosis risk may be indicative of shared traumas and stress across populations. Many factors such as current events, regressive policies and technology usage may be creating a sense of urgency and overwhelm for many across the country. An analysis of 4,048 responses from those at risk for psychosis (for the question, “Think about your mental health test. What are the main things contributing to your mental health problems right now?”) reveals common themes of loneliness, trauma, inability to describe complex emotions, and anxiety surrounding social situations:.
- “An overwhelming sense that everyone is observing and judging all of my actions at all times”
- “Being extremely mean to others all the time”
- “Reliving traumatic experiences”
- “Feeling alone even though I’m not alone”
- “Frightened by thoughts that Satan is speaking to me”
- “I cannot pull myself out of the depth of my brain sometimes.”
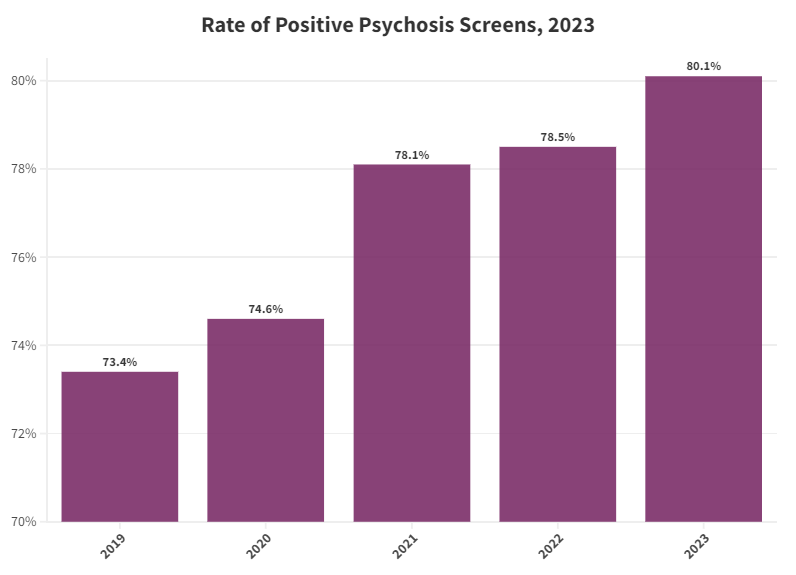
Psychosis risk on the rise
MHA uses the Prodromal Questionnaire – Brief version (PQ-B) to screen for psychosis. In total, 110,074 individuals took the psychosis screen in 2023, a 21% decrease from 2022 (N=140,327). Despite this decrease, rates of those at risk for psychotic experiences have continued to increase since pre pandemic rates - from 73% at risk in 2019 to a staggering 80% in 2023.
Similar to depression screen trends, youth under 18 were more likely to score with moderate to severe symptoms of anxiety than any other age group throughout the pandemic. Eighty-four percent (N=181,008) of those under 18 who took an anxiety screen in 2022 scored with symptoms of moderate to severe anxiety.
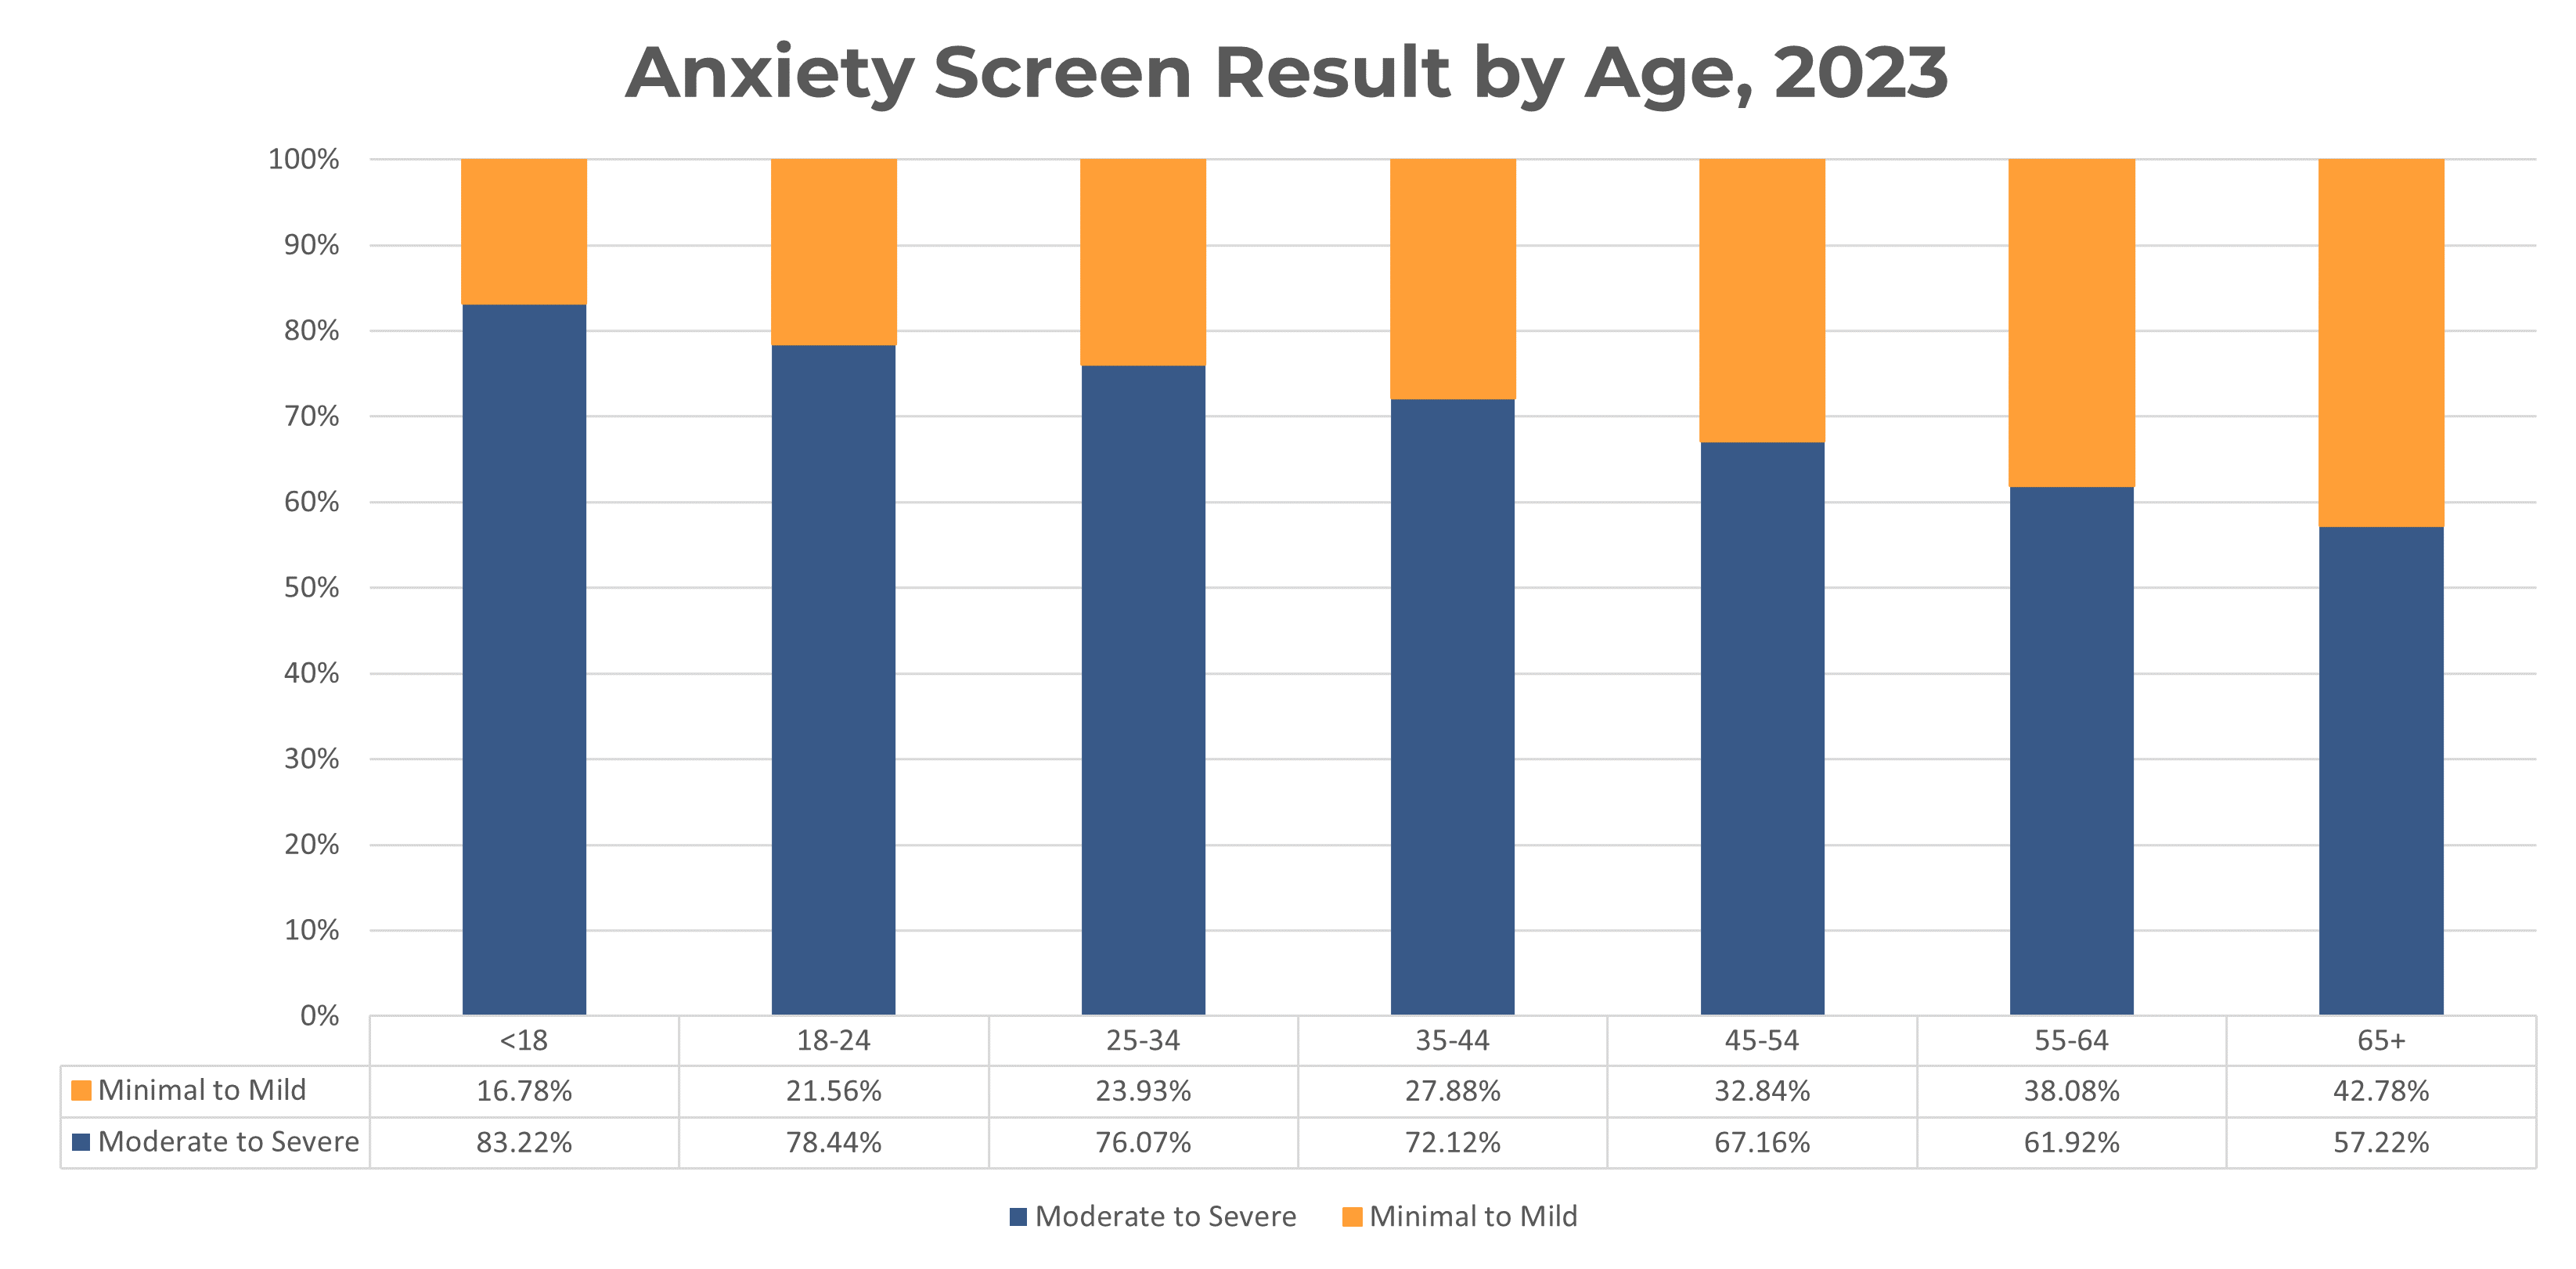
Rates of moderate to severe anxiety in 2023 varied by race/ethnicity. The percentage of people in 2023 scoring with moderate to severe symptoms of anxiety was highest among American Indian or Alaska Native screeners (84%). Every other race/ethnicity saw stagnation or a decrease in severity. Notably, Middle Eastern or North African screeners’ severity rates dropped 4% between 2022 (80%) and 2023 (76%).
American Indian Or Alaska Native: 83.88%
Asian: 72.66%
Black Or African American (Non-Hispanic): 75.20%
Hispanic Or Latino: 77.13%
Middle Eastern Or North African: 75.46%
Native Hawaiian Or Other Pacific Islander: 78.80%
White (Non-Hispanic): 78.55%
More Than One Of The Above: 81.67%
Other: 80.65%
Interestingly, from 2022-2023, anxiety severity decreased for all age groups - but remained stagnant for youth (around 83%) and slightly increased for 65+ (from 55% to 57%). Now more than ever, both populations are facing challenges: On one hand, youth may be battling issues with sense of self, stress from school, and relationship issues; on another hand, the 65+ population may be worried about the future, stress of caregiving, grief, and deteriorating health. Below are responses to the question, “Think about your mental health test. What are the main things contributing to your mental health problems right now?”
Youth Under 18, At Risk for Anxiety
- “Abandonment of a parent”
- “I make [others’] life worse.”
- “College admissions [and] the fear of not being a good person”
- “Emotional abuse from classmates”
- “Everyone I loves leaves me and I’m only 10 pounds less than my [older] brother”
- “Having trouble socializing and feeling comfortable in social situations”
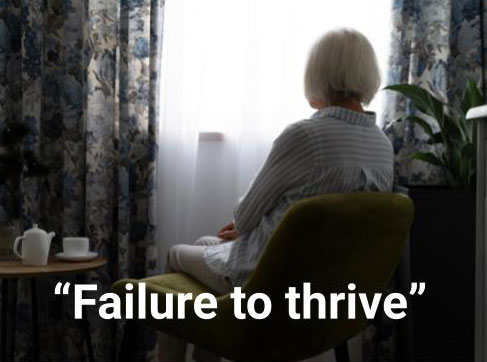
Over 65, At Risk for Anxiety
- “Aging and deteriorating health, increasing loss of mobility”
- “Failure to thrive”
- “Living with a terminally ill spouse”
- “Overwhelmed by caring for two older adults”
- “Dr appointments missed because they are over 75 miles away”
- “A wasted life using up resources that could be used by someone more deserving”
- “Worried about becoming dependent as I get older”
Substance use issues plague all ages, especially transitional youth
MHA uses the CAGE-AID tool to screen for alcohol and/or substance use disorders (SUD). In 2023, 22,236 people took the addiction screen. In addition, we also ask users “What substance or addiction are you concerned about?” In 2023, the most common drug used by our screeners was alcohol (48%, N=10,526), followed by marijuana (44%, N=9,680) and other substances (35%, N=7,694).
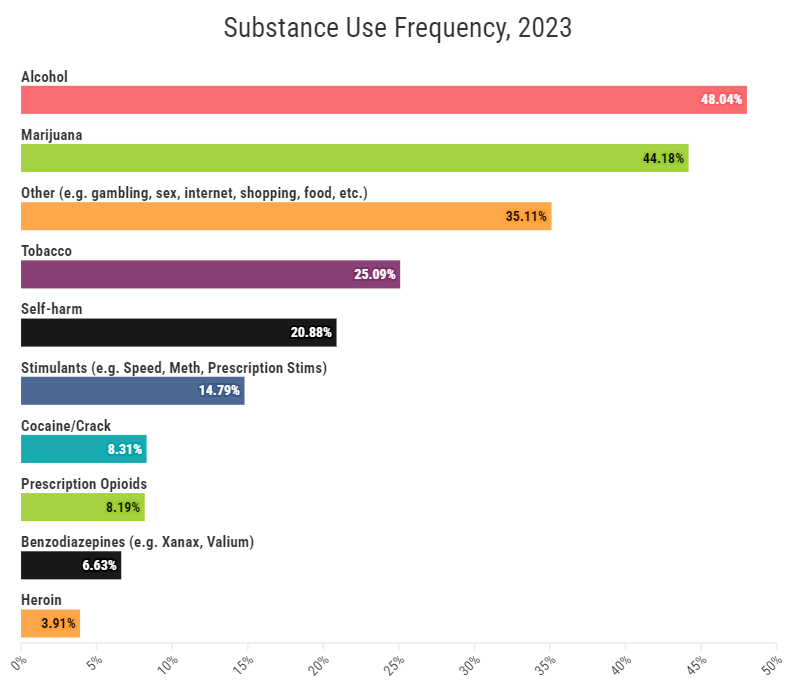
Women made up about 56% of SUD screens, which is slightly less than the rate of female screeners from the general population. Women also were most at risk, with 81% of female screeners (N= 9,923) receiving a “Likely Alcohol or Substance Use Problem” result. Despite taking the CAGE-AID at a less frequent rate, male (79%, N=6,964) and non-binary (76%, N=733) screeners had a comparable amount of those at high risk.
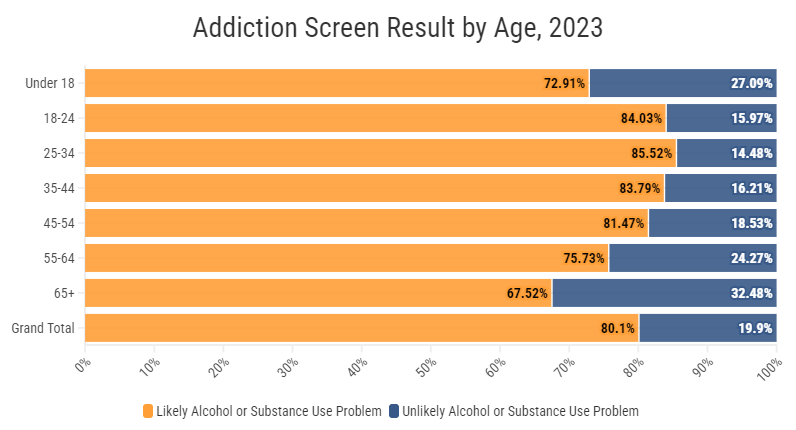
Interestingly, MHA’s transitional youth (age 18-24) population takes the CAGE-AID at a similar frequency (28%, N=6,087) as the youth (under 18) population (31%, N=6,736). Transitional youth (84%, N=5,115) also had more people scoring at risk than youth under 18 (73%, N=4,911) despite making up less of the SUD screen population. Screeners between the ages of 25-34 were the most at risk (86%).

IMHA recognizes that there is a lot of fear and reluctance to seek help for alcohol and substance use. Analysis of users’ written responses to the question, “Think about your mental health test. What are the main things contributing to your mental health problems right now?” demonstrates self-deprecation, difficulty managing addiction, and apathy:
- “Ashamed because i know i can do better but i still do the same things over and over”
- “Disappointed that I have addictions that are too hard for me to quit”
- “Just hating myself all around”
- “no self control sometimes, especially when i feel low”
- “No interest in anything”
- “Losing custody of my children”
Self-image, relationships, and school and work are top concerns
In April 2022, MHA revised answer choices to the question, “Think about your mental health test. What are the main things contributing to your mental health problems right now? Choose up to three.” In 2023, issues with body image or self image remained a top concern across all screens for those at risk. Concerns over school and work notably increased 5% from 2022 to 2023.
- Body image or self-image: 58.11%
- Relationship problems (friends, family, or significant other): 49.14%
- School or work problems: 47.42%
- Loneliness or isolation: 45.60%
- Financial problems: 19.18%
- Grief or loss of someone or something: 15.39%
- Abuse or violence: 9.12%
- Racism, homophobia, transphobia, or discrimination: 4.88%
- Basic needs (no food or housing): 2.81%
Among youth under 18 who scored positive or with moderate to severe symptoms of a mental health condition, body image or self-image and relationship problems remained top concerns, with both being selected less frequently in 2023 than in 2022. School or work problems was the second most popular concern and was selected at a more frequent rate in 2023 than 2022.
- Body image or self-image: 66.67%
- School or work problems: 59.83%
- Relationship problems (friends, family, or significant other): 51.48%
- Loneliness or isolation: 46.92%
- Grief or loss of someone or something: 13.02%
- Abuse or violence: 9.88%
- Racism, homophobia, transphobia, or discrimination: 7.87%
- Financial problems: 3.31%
- Basic needs (no food or housing): 1.37%
Although the averages across screeners reveal the main concerns of the general population throughout this year, post-pandemic events have had profoundly different mental health impacts on different racial and ethnic groups, and the differences reveal some of the inequities that Black, Indigenous, and people of color face in the U.S. that directly affect their mental health.
Among the screeners who scored positive or moderate to severe for a mental health condition and reported their race/ethnicity in 2023:
- American Indian or Alaska Native screeners were most likely to select abuse or violence (14%), followed by screeners who identified as Other (14%) and Native Hawaiian or other Pacific Islander screeners (13%).
- Black or African American screeners were most likely to select relationship problems (53%) followed by Native Hawaiian or other Pacific Islander screeners (52%) and multiracial screeners (51%).
- Screeners who identified as Hispanic or Latino were most likely to select body image or self-image (62%) followed by American Indian or Alaska Native screeners (61%) and multiracial screeners (61%).
- Asian screeners were most likely to select school or work problems (60%) followed by Middle Eastern or North African screeners (56%) and screeners who identified as Hispanic or Latino (50%).
- Native Hawaiian or other Pacific Islander screeners were most likely to select basic needs (4%) followed by Black or African American screeners (4%) and American Indian or Alaska Native screeners (4%).
- Black or African American screeners were most likely to select financial problems (24%), followed by Native Hawaiian or other Pacific Islander screeners (22%) and white screeners (21%).
- Screeners who identified as more than one race were most likely to select loneliness or isolation (47%), followed by screeners who identified as Hispanic or Latino (47%) and Black or African American screeners (47%).
- American Indian or Alaska Native screeners were most likely to select grief or loss (19%) followed by white screeners (17%), and screeners who identified as Other race (16%).
- Screeners who identified as Other race were most likely to select racism, homophobia, transphobia, or discrimination (8%), followed by screeners who identified as more than one race (7%) and American Indian or Alaska Native screeners (7%).
Main concerns, scoring positive for a mental health condition by race/ethnicity, 2023
- American Indian or Alaska Native: 14.39%
- Asian: 7.95%
- Black or African American (non-Hispanic): 9.75%
- Hispanic or Latino: 9.19%
- Middle Eastern or North African: 10.60%
- Native Hawaiian or other Pacific Islander: 13.07%
- White (non-Hispanic): 8.58%
- More than one of the above: 10.79%
- Other: 14.06%
- American Indian or Alaska Native: 50.08%
- Asian: 50.48%
- Black or African American (non-Hispanic): 52.70%
- Hispanic or Latino: 51.17%
- Middle Eastern or North African: 49.46%
- Native Hawaiian or other Pacific Islander: 51.68%
- White (non-Hispanic): 47.65%
- More than one of the above: 51.32%
- Other: 48.50%
- American Indian or Alaska Native: 60.88%
- Asian: 54.28%
- Black or African American (non-Hispanic): 52.33%
- Hispanic or Latino: 62.35%
- Middle Eastern or North African: 56.07%
- Native Hawaiian or other Pacific Islander: 55.60%
- White (non-Hispanic): 58.04%
- More than one of the above: 60.89%
- Other: 57.51%
- American Indian or Alaska Native: 47.55%
- Asian: 60.37%
- Black or African American (non-Hispanic): 47.22%
- Hispanic or Latino: 49.72%
- Middle Eastern or North African: 55.84%
- Native Hawaiian or other Pacific Islander: 46.25%
- White (non-Hispanic): 44.91%
- More than one of the above: 49.35%
- Other: 48.00%
- American Indian or Alaska Native: 3.92%
- Asian: 1.36%
- Black or African American (non-Hispanic): 4.38%
- Hispanic or Latino: 2.65%
- Middle Eastern or North African: 2.21%
- Native Hawaiian or other Pacific Islander: 4.42%
- White (non-Hispanic): 2.76%
- More than one of the above: 2.86%
- Other: 3.41%
- American Indian or Alaska Native: 13.04%
- Asian: 13.74%
- Black or African American (non-Hispanic): 23.72%
- Hispanic or Latino: 18.88%
- Middle Eastern or North African: 13.16%
- Native Hawaiian or other Pacific Islander: 21.75%
- White (non-Hispanic): 20.54%
- More than one of the above: 16.04%
- Other: 11.75%
- American Indian or Alaska Native: 43.31%
- Asian: 47.24%
- Black or African American (non-Hispanic): 46.76%
- Hispanic or Latino: 46.76%
- Middle Eastern or North African: 46.13%
- Native Hawaiian or other Pacific Islander: 42.87%
- White (non-Hispanic): 44.94%
- More than one of the above: 47.28%
- Other: 42.43%
- American Indian or Alaska Native: 18.96%
- Asian: 9.42%
- Black or African American (non-Hispanic): 15.89%
- Hispanic or Latino: 12.98%
- Middle Eastern or North African: 11.20%
- Native Hawaiian or other Pacific Islander: 16.30%
- White (non-Hispanic): 16.52%
- More than one of the above: 15.02%
- Other: 16.43%
- American Indian or Alaska Native: 6.93%
- Asian: 5.40%
- Black or African American (non-Hispanic): 6.45%
- Hispanic or Latino: 4.07%
- Middle Eastern or North African: 6.09%
- Native Hawaiian or other Pacific Islander: 4.51%
- White (non-Hispanic): 4.28%
- More than one of the above: 7.26%
- Other: 7.84%